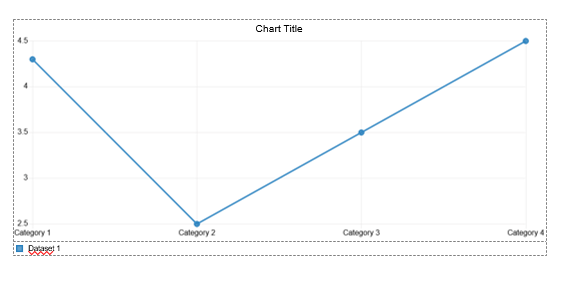
Using a line graph. I’m trying to figure out how to modify the Y axis. Take this example:
Given these data points, if I want the scale on the vertical axis to start at 1 and go to 10 with only whole numbers. Where are the settings to modify the axis in this way?
That’s too bad. Can I make that I feature request then? I teach about data and graphing frequently, and without being able to modify the axis scale, I won’t be able to use the (otherwise wonderful) built in graph feature.