Long time no see.
Chart is one of the impressive new features that come along with ActivePresenter 9.
Hope that my answers below will address your concern:
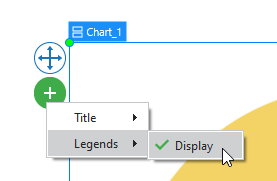
Just select the chart > click the green plus button. Then you can decide to show/hide the legends.
At this time, ActivePresenter just allows displaying the Chart label when hovering the mouse over each category of the chart in HTML5.
A Pie chart can show only one Dataset. If you want to display many Dataset with the round type, please consider using the Doughnut chart.
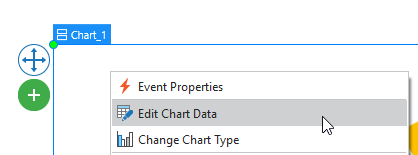
After importing a Pie chart from Powerpoint, right-click it > Edit Chart Data to show up the excel table.
5 & 6. These are not available in the current version of ActivePresenter.
Kindly refer to this article to grab basic information about creating chart: How to Create Charts and Graphs in ActivePresenter 9
After releasing the new version, we keep working to enhance the features to optimize user experiences.